
Case

Application

FAQ
Data Management Gaps in PCB Factories?
Case|Data Management Gaps in PCB Factories?As smart manufacturing and data-driven decisions sweep across factories, more companies are focusing on real-time monitoring to quantify and optimize production resources. One practical and cost-effective method is repurposing signal tower lights for automated equipment utilization data collection.
Background: Importance and Challenges of the PCB Routing Process
In today's highly competitive PCB (Printed Circuit Board) industry, equipment utilization efficiency affects not only line performance but also delivery time and cost.
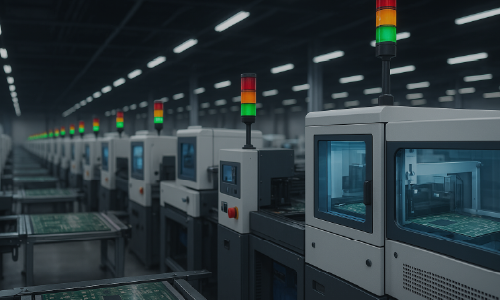
PCB Router
Also known as depaneling or routing machines, routers are used in mid-to-late PCB processes to precisely cut large boards into single boards ready for shipment.
Pain Points
The factory uses 10 automated routers, each equipped with traditional three-color tower lights.
These indicators were only used for on-site visibility, never considered as usable data assets.
With a company-wide push for OEE tracking, the routing process was chosen as the first phase due to high output per machine and human dependency.
Blind Spots Caused by Data Gaps
Although the factory has an MES system recording partial production data, the routers are not connected to automatic status feedback modules, making it difficult to accurately quantify uptime and downtime reasons.
Supervisors manually fill out estimated equipment uptime every day, and engineers consolidate the data manually, which is time-consuming and cannot reflect real-time anomalies.
Furthermore, common downtime reasons such as "tool change", "material wait", or "operator away" are often not classified as abnormal and are excluded from records.
These frequent micro-downtimes can significantly affect equipment availability.
In some night shifts, managers cannot monitor operations in real time, causing prolonged yellow-light standby without timely handling—leading to hidden capacity losses.
Summary of Pain Points
1. Lack of real-time utilization data
Relying on manual records leads to missing, delayed, or inaccurate information.
2. Unquantified unexpected downtime
Tool changes, material waits, and operator absence are not systematically recorded.
3. Poor night shift visibility
Night shift managers cannot respond quickly, increasing yellow-light idle time.
4. Inability to classify downtime reasons
Human errors and machine faults are not clearly separated for actionable insights.
5. Tool wear not linked to machine status
Declining yield or cutting performance is not visible when lights still show green, making early warning difficult.
How is it detected?
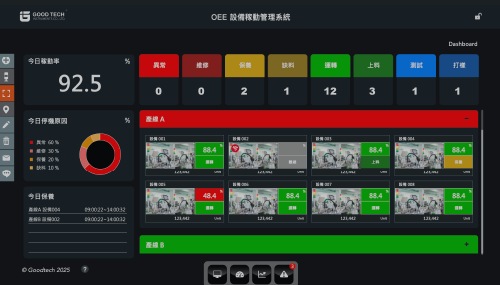
OEE Equipment Utilization Management System
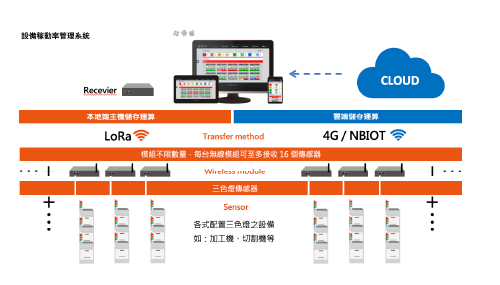
By utilizing existing signal tower lights, combined with sensors and wireless transmission modules, a low-intrusion monitoring system can be established to collect operational data effectively.
Measurement Status
To address the aforementioned issues, GoodTech and the factory collaborated to propose a simple yet efficient solution:
Using existing signal tower lights combined with sensors and wireless transmission modules to build a low-intrusion monitoring system.
The signal lights of each router are captured via voltage sensors or PLC signal splitters, then converted into standardized digital signals and transmitted to the system.
The system automatically logs green as “Operating”, red as “Abnormal Downtime”, and yellow as “Standby or Switching”.
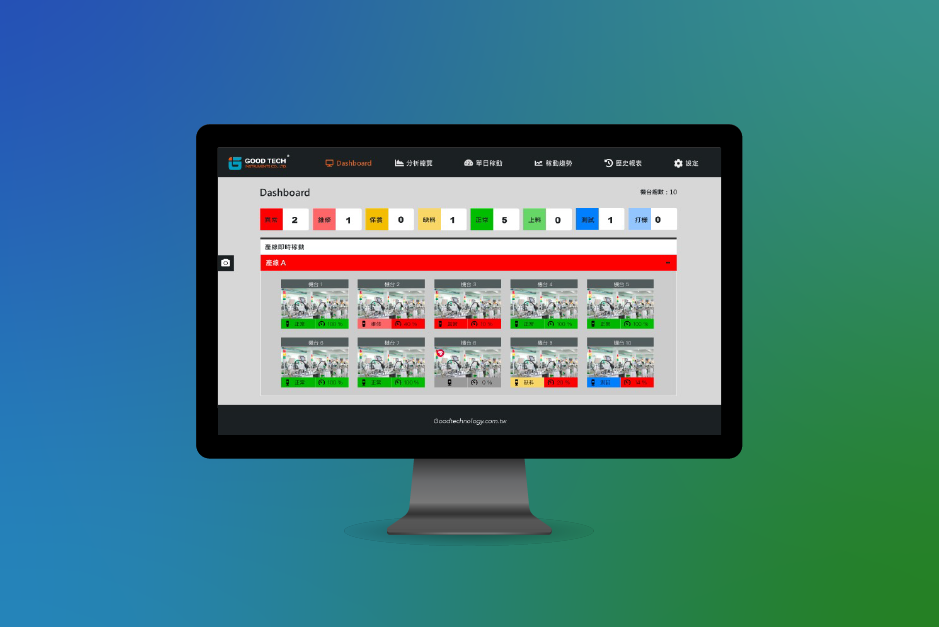
These data are synchronized in real time to the OEE analysis platform and can be accessed through central dashboards, laptops, or mobile devices.
The system also supports historical data statistics such as shift-wise, daily, and weekly trends in utilization rate, total downtime, frequency, and impact analysis.
Implementation Results
Efficiency Gains and Process Optimization
About one month after implementing the signal tower monitoring system, the technical team uncovered several hidden issues:
1. Two older machines showed significantly lower utilization during night shifts. Investigation revealed that night shift staff were unfamiliar with the tool change procedure, leading to prolonged yellow-light status.
----- After enhanced night shift training, utilization in that area increased from 75% to 88%.
2. Downtime analysis revealed that tool changes accounted for 30% of total daily downtime.
The team later implemented a scheduled preemptive tool change policy, reducing unexpected tool change time by about 20%.
3. By comparing runtime with production output, the team identified an operator who forgot to stop the machine after production, falsely reporting green-light runtime.
----- The system provides daily line-by-line utilization rates, enabling immediate comparison and correction.
Additionally, as managers can remotely monitor equipment status and utilization, on-site inspection frequency was reduced by 30%, allowing engineers to focus more on anomaly prevention and yield improvement.
Overall, the factory achieved an average OEE increase of approximately 9.4% within three months and gained a scalable model for future expansion to other equipment.
| Issue Type | Efficiency |
|---|---|
| Automated Utilization Calculation | The system records run time, standby, and downtime via real-time signal tower inputs. Utilization data is instantly generated. |
| Identify Bottlenecks & Abnormalities | Downtime classification (e.g., tool change, material wait) supports process improvement and scheduling decisions. |
| Remote Real-Time Monitoring | Via local connection to mobile devices, managers can check machine status anytime, improving management efficiency. |
| Training & Task Assignment | Utilization data reveals operator performance gaps, supporting targeted training and optimized workforce allocation. |
| Overall Equipment Effectiveness | Within 3 months of implementation, average utilization improved by ~9.4%, with a 30% reduction in engineer patrol time. |
Conclusion
From Signal Lights to Data: Moving Toward Transparent Manufacturing
Signal tower lights, once merely visual indicators on the factory floor, have now become foundational data sources for smart manufacturing.
Through simple signal capture and backend logic, subjective records are replaced by real-time, visualized, and analyzable equipment utilization metrics.
In high-turnover, high-precision environments like PCB manufacturing, auxiliary but critical equipment such as routers often become production bottlenecks due to lack of transparent management.
This case demonstrates a low-cost, highly scalable solution and shows that companies can move steadily toward smart automation by starting from operational details.
Are you struggling to clearly understand the status of machines on your production line?
How long have they been idle? Were issues handled in real time?
Are there machines that are constantly malfunctioning? How much time is wasted waiting for materials?
With labor shortages in the factory, how can one person manage multiple machines?
OEE Equipment Utilization Monitoring System
This system is suitable for all types of factory equipment equipped with signal tower lights, such as CNC machines and cutting machines.
Paired with light sensors that are easy and quick to install, the system collects data through the sensors and visualizes equipment status and utilization in real time.
With graphic-based data management, users can easily grasp the conditions of the production line.
OEE Equipment Utilization Monitoring
Monitor utilization anytime, anywhere
FAQ
What is OEE equipment utilization rate?
OEE (Overall Equipment Effectiveness) is an important indicator for measuring actual equipment production efficiency. OEE is mainly composed of three indicators: availability, performance efficiency, and quality rate. It can assist enterprises in understanding equipment utilization and production line efficiency, serving as a critical basis for improving production management.
Why do PCB factories need to implement an OEE management system?
PCB manufacturing is a high-turnover, high-precision industry. Equipment utilization efficiency directly affects product delivery times, production capacity, and cost structure. Through the OEE management system, equipment status, production efficiency, and downtime information can be grasped in real-time, allowing for the quick discovery of capacity bottlenecks and improved equipment utilization.
How do three-color lights calculate equipment utilization?
By installing optical sensors to capture the equipment's three-color light signals, the equipment's operating, standby, and abnormal states can be automatically determined. After the system converts the light status into data, it can automatically calculate the equipment utilization rate, replacing manual recording methods and improving management efficiency and data accuracy.
What problems does low equipment utilization usually indicate?
Low equipment utilization usually indicates excessively long downtime, poor production scheduling, frequent equipment failures, improper manual operation, or excessively long waiting times for materials. Through the OEE system, the root causes of efficiency decline can be further analyzed.
What information can the OEE system help manage?
The OEE system can display equipment status, utilization rate, downtime, production efficiency, abnormal events, maintenance progress, and historical trend data in real-time. It can also integrate with third-party systems such as ERP, MES, and CRM to help enterprises build a complete digital management architecture.
What are the benefits of implementing an OEE equipment utilization management system?
After implementing the OEE system, it can improve equipment utilization, reduce downtime, lower manual inspection costs, quickly grasp abnormal situations, and improve production efficiency. In this case, through the digital management of three-color lights, the problem of false green light reporting was successfully discovered, and the average utilization rate of the entire line was increased by about 9.4% within three months.
Further Reading
The impact of environmental micro-vibration on Laser Grooving machines?
How to ensure screw manufacturing quality and prevent mold damage?
Abnormal automated stud welding causing poor object joints?
Does the cutting stability of the drilling and tapping machine affect product quality?
OEE Equipment Utilization Management System
Equipment Utilization Rate Management
Maintenance speed increased by 7 times, saving annual maintenance budget