
Case

Application

FAQ
Is the Issue the Environment or Vibration Isolation?
Monitoring Cases | Environment or Vibration Isolation?Addressing common environmental vibration issues in precision equipment, this systematic empirical analysis explores the differences between floor environmental vibration and equipment platform isolation effects. By comparing vibration distribution across different areas and analyzing the impact of machine operation and personnel activity on vibration levels (VC-Curve).
Scenario Description
This measurement case stems from a client's need for stability in precision equipment. During operation, the client found that some measurement data showed instability in low-frequency regions, affecting equipment status interpretation and manufacturing precision. To clarify vibration sources and evaluate improvement directions, this study systematically analyzes environmental vibration and platform isolation effects.
Considering the multiple sources of vibration, this study is divided into two levels. First is the floor environmental vibration analysis, evaluating distribution characteristics and main interference sources under different areas and operating conditions (machine on/off, personnel activity). Second is the equipment platform vibration analysis, comparing the differences between the machine platform and anti-vibration table under various air-float isolation states.
Monitoring Description
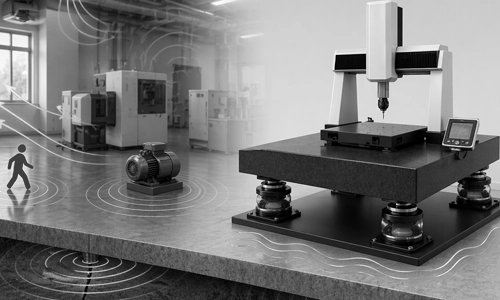
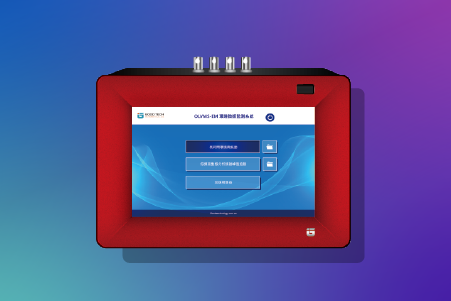
VMS-EM Environmental Micro-vibration Analyzer
Utilizing the VMS-EM Environmental Micro-vibration Analyzer, vibration velocity (μm/s, RMS) is used as the evaluation index. Grading is determined based on VC-Curve micro-vibration specifications to establish the correlation between environmental vibration, equipment operation, and isolation systems.
Measurement Conditions
Environmental Vibration Analysis (Floor)
Focus: Where is the most vibration? What is the source (People / Machines)?
To compare the impact of different areas and operating conditions on floor vibration, the data is summarized below:
| Location | On (Personnel present) | On (No personnel) | Off (Personnel present) | Off (No personnel) |
|---|---|---|---|---|
| Machine A Floor | Z: 7.59μm/s Z: VC-C | Z: 5.89μm/s Z: VC-D | Z: 6.80μm/s Z: VC-C | Z: 5.49μm/s Z: VC-D |
| Machine B Floor | Z: 17.03μm/s Z: VC-B | Z: 16.32μm/s Z: VC-B | Z: 12.37μm/s Z: VC-C | Z: 12.37μm/s Z: VC-C |
| Machine D Floor | Z: 7.52μm/s Z: VC-C | Z: 6.96μm/s Z: VC-C | Z: 6.42μm/s Z: VC-C | Z: 7.29μm/s Z: VC-C |
| Machine E Floor | ---- | ---- | Z: 42.28μm/s Z: VC-A | Z: 38.59μm/s Z: VC-A |
| DEMO Area Floor | ---- | ---- | Z: 7.37μm/s Z: VC-C | Z: 6.40μm/s Z: VC-C |
| Lab Area Floor | ---- | ---- | Z: 7.59μm/s Z: VC-C | Z: 5.89μm/s Z: VC-D |
Machine Impact
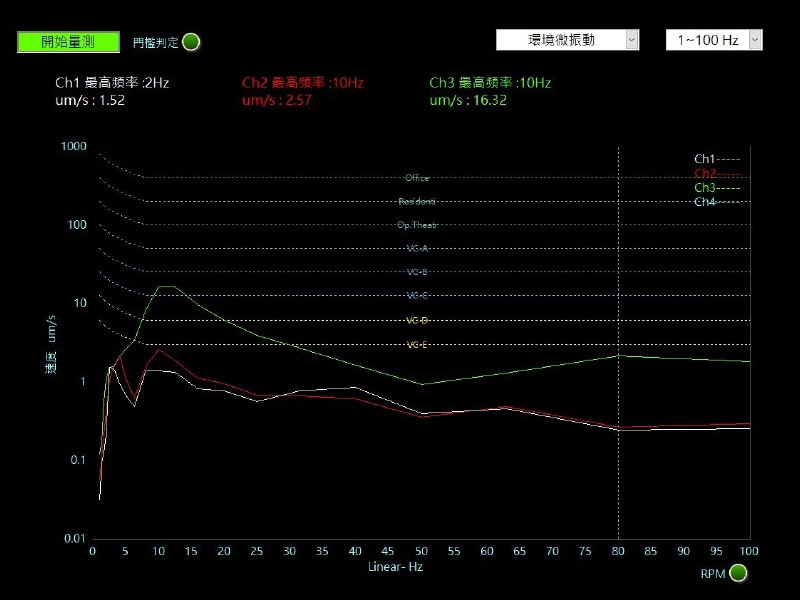
Machine B Power On, No Personnel
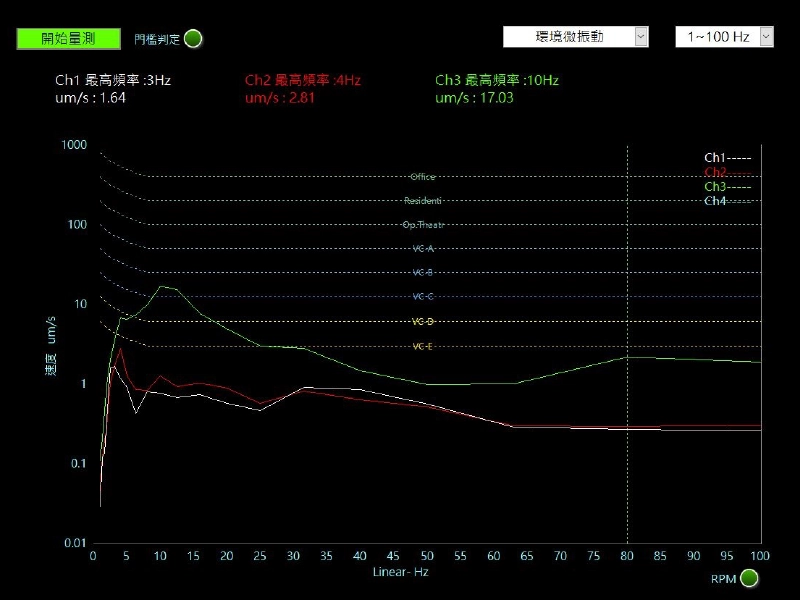
Machine B Power On, Personnel Walking
Machine B Power Off, Personnel Walking
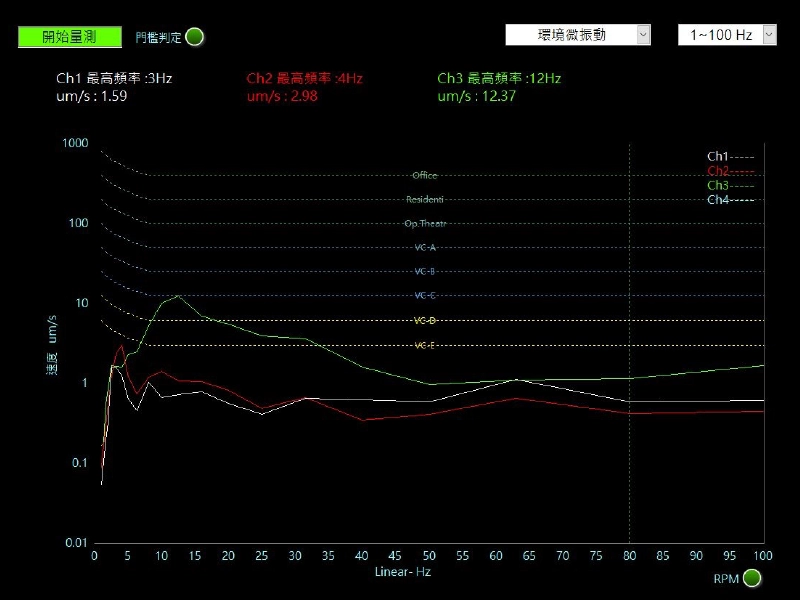
Machine B: Power On → VC-B (16~17 um/s); Power Off → VC-C (12 um/s)
Conclusion: Machine operation increases the vibration level by one grade (VC-C → VC-B).
Personnel Impact (Low-frequency Interference Source)
Machine A: Power On, No Personnel
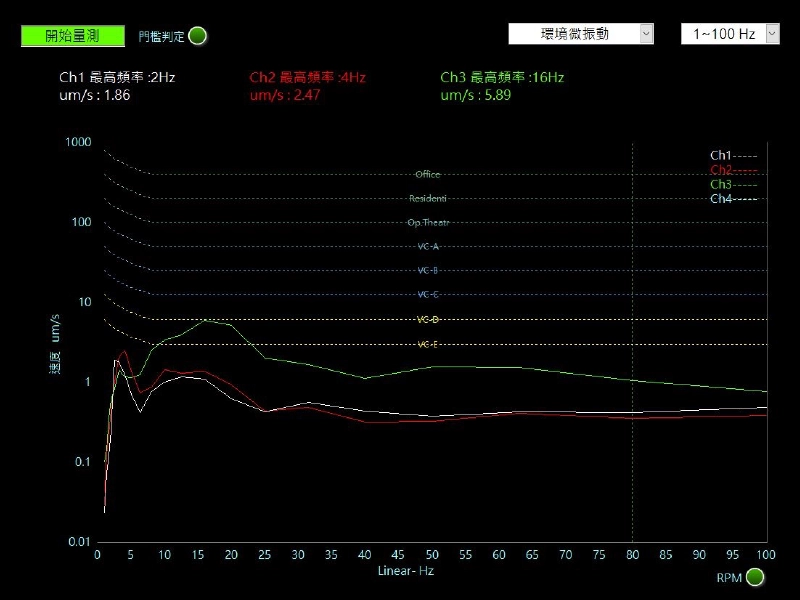
Machine A: Power On, Personnel Walking
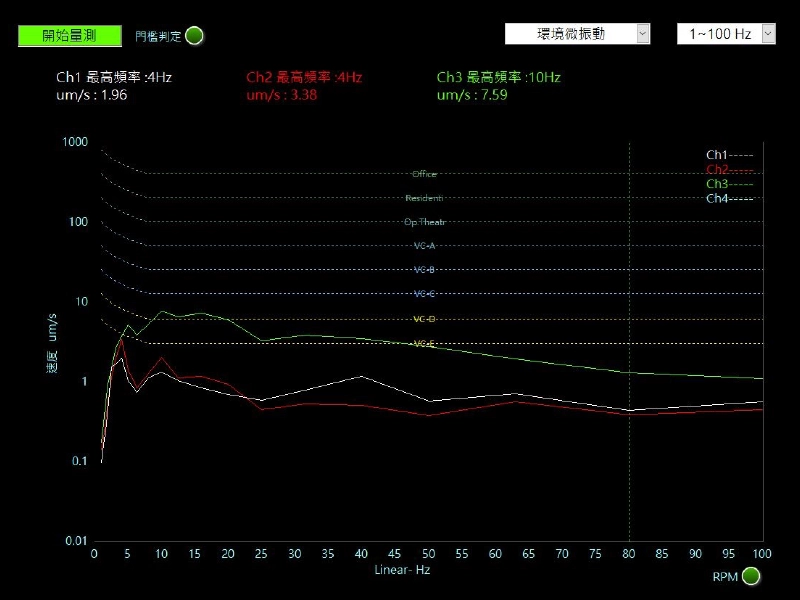
Machine A: No Personnel (On) → 5.89 → VC-D; With Personnel (On) → 7.59 → VC-C
Conclusion: Personnel activity causes vibration to rise, reaching a full grade difference in some areas.
Regional Differences (Structure/Position Issues)
Machine E → 38~42 um/s → VC-A (Very High)
Machine D → Approx. 6~7 um/s → VC-C (Stable)
Conclusion: Floor vibration varies significantly across regions (up to 2-3 grades), indicating structural transmission differences or proximity to vibration sources.
Isolation Effect Measurement (Platform)
Summary of vibration data for platforms under various conditions:
| Location | Machine Off Isolation Off Vacuum Pump Off No Personnel | Machine On Isolation On Vacuum Pump Off No Personnel | Machine On Isolation On Vacuum Pump Off Personnel Walking | Machine On Isolation On Vacuum Pump On No Personnel |
|---|---|---|---|---|
| Machine A Platform | Z: 7.62μm/s Z: VC-C | Z: 5.71μm/s Z: VC-D | Z: 9.73μm/s Z: VC-C | Z: 3.70μm/s Z: VC-D |
| Machine A Gantry | ---- | ---- | ---- | Z: 8.7μm/s Z: VC-C |
| Machine B Platform | X: 37.37μm/s X: VC-A | X: 46.62μm/s X: VC-A | X: 53.21μm/s X: Operating theatre | ---- |
| Machine C Platform | Z: 11.99μm/s Z: VC-C | ---- | Z: 3.26μm/s Z: VC-D | Z: 3.41μm/s Z: VC-D |
* (Operating theatre is an ISO standard corresponding to low vibration levels)
Effect of Isolation Air Source
Machine A Platform:
• Air Off → 7.62 um/s (VC-C)
• Air On → 5.71 um/s (VC-D)
• Vacuum Pump On → 3.70 um/s (VC-D)
Air-float isolation significantly reduces vibration (approx. 25~50%).
Conclusion: Vibration level improves by one grade (VC-C → VC-D).
Personnel Walking Impact
Machine A Platform:
• Air-float ON + No Personnel → 5.71 um/s (VC-D)
• Air-float ON + Personnel → 9.73 um/s (VC-C)
Conclusion: Personnel walking offsets part of the isolation effect (potentially reverting by one grade).
Machine Differences (Structure/Vibration Source)
Machine B Platform:
• Off → 37.37 um/s (VC-A)
• On → 46.62 um/s (VC-A)
• Personnel Present → 53.21 um/s (Exceeds VC-A → Operating theatre)
Conclusion: Machine B itself is a strong vibration source; isolation effect is limited.
Optical Anti-vibration Table (Machine C)
Machine C:
• Original → 11.99 (VC-C)
• Air-float ON → 3.26 / 3.41 (VC-D)
Conclusion: Isolation effect is remarkable (reduction of approx. 70%).
VMS-EM Environmental Micro-vibration Analyzer
Environment, machinery, and product quality are closely linked. Confirming environmental suitability before installation reduces setup time and troubleshooting. The VMS-EM is designed for factory micro-vibration detection to help find the ideal installation site.
Measurement Conclusion
Results indicate that environment and platforms affect vibration levels differently.
On the floor, vibration is mainly driven by machine operation and personnel. Machines cause a shift from VC-C to VC-B, while personnel walking increases low-frequency interference, often bumping the vibration grade up.
Significant baseline differences exist between areas, with some reaching VC-A due to structural factors.
When the air-float system is active, platform vibration can improve from VC-C to VC-D (30%–70% reduction), showing strong suppression capabilities. However, low-frequency interference like walking can revert this. For high-vibration sources like Machine B, isolation platforms alone are insufficient.
Therefore, a strategy integrating "Source Control, Environmental Improvement, and Isolation Design" is essential for precision measurement reliability.
FAQ
Why should environmental vibration be checked first when precision measurement becomes inaccurate?
Precision equipment is prone to measurement instability, decreased process accuracy, or misjudgment of equipment status under low-frequency vibration. If the source of vibration—whether the floor environment, equipment body, personnel activity, or vibration isolation platform—is not distinguished first, the direction of improvement may be misjudged. Therefore, systematic environmental micro-vibration measurement is required.
What is the VC-Curve micro-vibration standard?
The VC-Curve is a vibration level standard used to evaluate the impact of environmental vibration on precision equipment. By comparing the vibration velocity in μm/s RMS with the VC-Curve criteria, it can be determined whether the current environment is suitable for the operation of precision measurement, semiconductor equipment, or other high-precision equipment.
How to determine whether the problem comes from the environment or the equipment itself?
The floor environmental vibration and the equipment platform vibration can be measured separately, and the vibration changes can be compared under conditions such as machine on/off, personnel clearance, personnel walking, and isolation air supply on/off. If the vibration decreases after shutting down, it indicates that the machine body might be the source. If there is a huge difference between different areas, it may be related to structural transmission or adjacent vibration sources.
Do personnel walking affect the measurement of precision equipment?
Yes. In the case study, personnel walking causes an increase in low-frequency vibration, and the vibration level in some areas can rise by one grade. For example, Machine A is at VC-D when turned on and unattended, but rises to VC-C after personnel walking, indicating that personnel activities can become a source of intermittent interference for precision measurement.
Can air suspension vibration isolation systems completely solve vibration problems?
Not necessarily. Air suspension vibration isolation systems can significantly reduce platform vibration; for example, some equipment platforms can be improved from VC-C to VC-D, with the vibration amplitude reduced by about 30% to 70%. However, under low-frequency interference such as personnel walking or when the equipment body itself is a strong vibration source, the isolation effect may still be limited.
What are the benefits of implementing VMS-EM environmental micro-vibration analysis?
VMS-EM can help confirm whether the factory environment is suitable for precision equipment before installation, and identify the vibration relationships among the floor, personnel activities, equipment body, and vibration isolation platform. Through environmental improvement, vibration source control, and vibration isolation design integration, measurement stability, equipment reliability, and process quality can be improved.
Further Reading
The impact of environmental micro-vibration on Coater equipment?
The impact of environmental micro-vibration on Laser Grooving machines?
Does laboratory environmental micro-vibration affect equipment accuracy?
Is the gantry vibrating excessively during FIMS machine operation?
VMS-EM Environmental Micro-vibration Analyzer
What is environmental micro-vibration?
Maintenance speed increased by 7 times, saving annual maintenance budget