Case

Application

FAQ
What is FFT and Spectrum Analysis?
FAQ|What is FFT and Spectrum Analysis?#PDM
For many technical professionals and business managers without an academic background, FFT and spectrum analysis may sound abstract and difficult to grasp, and their practical applications and value are often misunderstood or underestimated.

What is FFT and Spectrum Analysis?
FFT (Fast Fourier Transform)
• A mathematical algorithm that converts time-domain signals (such as vibrations or sound waveforms) into frequency-domain data.
• Specifically, it is an efficient numerical implementation of the Fourier Transform.
• FFT is merely the “method” of transformation itself; it does not interpret the results.
Spectrum Analysis
• A signal analysis technique and process used to study how a signal is distributed across different frequencies.
• It usually includes FFT as one of its steps, but is not limited to it—it may also involve power spectral density, spectrogram comparison, and other advanced processing methods.
• Spectrum analysis is a broader concept, encompassing how the results of FFT are interpreted and applied.
Together, they complement each other, allowing engineers to move beyond relying solely on experience
To understand the value of FFT vibration analysis, we must first look at its mathematical principle. The Fourier Transform is a mathematical tool that converts time-domain signals into frequency-domain signals, breaking down seemingly chaotic vibration data into identifiable frequency components. The core idea is that: any periodic signal can be represented as a series of sine waves at different frequencies. For example, vibration data from a motor may contain the fundamental rotational frequency, as well as high-frequency or irregular waveforms caused by bearing wear, loose belts, or gear deterioration. These details, difficult to distinguish in a time series, can be clearly revealed in a spectrum after Fourier transformation.
However, traditional Fourier Transform has low computational efficiency, making it unsuitable for real-time monitoring. FFT (Fast Fourier Transform) is an optimized algorithm that performs Fourier Transform quickly in digital systems, ideal for real-time analysis of high-frequency and large-volume sensor data. This is the core value of FFT: it is not the final goal but rather the prerequisite tool for conducting “spectrum analysis.” Simply put, FFT is a sharp blade for signal decomposition, but true insights come from the interpretation and application of the spectrum results—that is, spectrum analysis.
When equipment operates, even if it appears normal on the surface, mechanical parts’ rotation, friction, and impacts generate subtle vibrations. These vibration signals are like the heartbeat and breathing of the machine, containing clues about its health status. To the naked eye, abnormalities are difficult to detect, but with the spectrum provided by FFT, signals can be decomposed and mapped in spectrum analysis to specific components and failure modes—such as motor speed, bearing wear frequencies, and gear deviations. Once an abnormal rise at a frequency is detected, potential issues can be identified early, enabling predictive maintenance.
In summary, the power of FFT lies in “translating” mechanical vibration signals that are not intuitively understandable into visual and quantifiable spectrum data. Spectrum analysis then gives these data meaning and actionable value. Together, they allow engineers to move beyond experience-based judgments and instead build predictive models based on data, enabling proactive maintenance strategies. This data-driven maintenance mindset is one of the essential core technologies in smart factories and the Industry 4.0 movement.
How to Perform FFT Vibration Analysis?
A typical FFT vibration analysis process consists of several steps, each crucial to data accuracy and diagnostic effectiveness. This process is not merely about mathematically transforming signals—it is about building a “machine health check and decision support system.” From sensor installation, data collection, and FFT transformation, to final spectrum analysis and predictive actions, every step requires the integration of industrial knowledge and data science.
First, engineers install high-sensitivity accelerometers at critical points of the equipment, such as motor bases, bearing housings, guide rails, or drive shafts. These locations are “signal hot zones” where abnormal vibrations most likely occur and are key points for analyzing failure mechanisms. Sensors are typically mounted using magnetic bases, bolts, or double-sided adhesive to ensure measurement stability and consistency.
These sensors continuously or periodically collect vibration data while the equipment is in operation. At this stage, edge computing modules are often used for preliminary filtering and storage, reducing data traffic and improving real-time performance. Signals can also be transmitted in real time to the cloud or internal servers through industrial communication protocols such as Modbus, CANopen, or OPC UA.
The next stage is FFT transformation. Raw vibration signals exist as time-domain waveforms, which cannot directly show frequency characteristics. Through the FFT algorithm, these data are transformed into a spectrum, displaying the energy intensity corresponding to each frequency point. These spectra act like X-rays of machine health, allowing anomalies to be spotted at a glance. Harmonics, sidebands, and asymmetric peaks are common fault indicators.
However, to truly gain diagnostic insights from spectra, further spectrum analysis is required. This stage involves not just observing the plots but comparing specific frequencies with the mechanical components they represent, based on equipment structure and physical principles. For example, inner-race defects in ball bearings appear at specific BPFI (Ball Pass Frequency of Inner Race), while gear wear shows as energy rises at the gear’s fundamental frequency and its sidebands. Using these characteristic frequencies, engineers can identify which component is failing and track whether its condition is deteriorating.
At this point, combining AI models with historical data comparison can greatly improve diagnostic accuracy. AI systems can learn the “normal spectral patterns” of different machines and trigger anomaly alerts when deviations occur. Trend analysis can also be applied to estimate the time until failure by monitoring the rate of change in energy within a certain frequency range, enabling true Predictive Maintenance.
Application Explanation:
Taking rotor machinery as an example: when the data acquisition card samples the voltage signal, the raw time-domain data are obtained first. Then, by applying FFT, these time-domain data are transformed into the frequency domain to obtain the distribution of signal energy across different frequencies. Frequency-domain data helps us analyze the frequency components of the signal and identify the dominant frequencies along with their amplitudes.
Next, according to ISO standards, we need to perform unit conversion on the frequency components in the frequency-domain data. These conversion coefficients are required to align the results with the standardized units specified by ISO, such as normalized values of vibration acceleration, velocity, or displacement. After these conversions, we can compare the signal characteristics with ISO standards to verify whether the current signal meets the requirements or exceeds allowable limits.
This process ensures a clear understanding of the system’s health status, allowing early detection of out-of-standard anomalies and enabling corrective actions.
FFT applied in predictive maintenance workflow:
1. Sensor Installation: Install triaxial accelerometers at key points (e.g., motor bases, bearing housings).
2. Data Collection: Continuously or periodically record vibration data during equipment operation.
3. FFT Transformation: Convert time-series data into spectra, separating different frequency components.
4. Anomaly Interpretation:
。 Example: Increase in 60Hz normal frequency ⇒ Motor speed increase
。 Spike at specific harmonics ⇒ Inner bearing wear or gear damage
5. Alerts & Prediction: Combine with machine learning models for trend analysis to predict failure time and schedule maintenance in advance.
Why is FFT More Accurate than Traditional Methods?
Many manufacturers adopting predictive maintenance often ask: “Why go through the trouble of using FFT? In the past, I could rely on experience or simply listening to sounds to detect problems accurately.” This doubt is reasonable, as traditional factories largely relied on skilled technicians’ years of experience and intuition to detect abnormal machine noises or vibrations. However, as equipment complexity increases and production lines become more automated, relying solely on human senses and experience is no longer sufficient to detect deeper mechanical abnormalities.
At this stage, the introduction of FFT becomes a key technological breakthrough. It not only provides higher signal resolution and diagnostic accuracy, but more importantly—it enables spectrum analysis to become visual, quantifiable, and predictive.
From the perspective of resolution, traditional time-domain data can only indicate the vibration magnitude (e.g., RMS value, peak value), but not “where the anomaly is” or “what caused it.” This is like using a thermometer to know someone has a fever, but not whether it is caused by an infection, internal bleeding, or nerve inflammation. By converting signals into the frequency domain using FFT, we can see the energy distribution of different frequency components. These frequencies are directly related to machine speed, bearing geometry, and gear count, allowing maintenance personnel to precisely identify faulty components. This mapping capability is the most critical source of information for spectrum analysis.
In terms of accuracy, spectrum analysis allows us to combine FFT results with engineering knowledge to make well-founded interpretations. For example, if equally spaced sidebands appear on a spectrum, it may indicate amplitude-modulated vibrations caused by bearing defects. If the energy in a certain frequency band rises abnormally and periodically, it may be related to load variations or resonance. Such interpretations cannot be achieved by FFT transformation alone; they require spectrum decoding by analysts familiar with machine operations and failure mechanisms, or by AI models. In other words, FFT provides the “ability to see,” while spectrum analysis provides the “ability to understand.”
Moreover, the greatest value of combining FFT with spectrum analysis lies in trend interpretation and anomaly evolution tracking. We can track the energy changes of a specific frequency over time to determine whether it is continuously rising, whether sidebands are beginning to appear, or whether it has shifted from a single frequency to multiple modes. These details provide the basis for predicting the time of failure. For example, if a machine’s 6kHz frequency energy is usually stable but has started showing a rising trend with increasing high-frequency noise over the past three weeks, it may indicate that fatigue damage of a component is developing. At this point, early scheduling of maintenance can achieve Zero-Downtime Maintenance.
Finally, spectrum analysis can also be applied to training machine learning models. Many predictive maintenance AI models are actually based on spectrum images for recognition (e.g., CNN convolutional neural networks) or feature vector extraction, rather than relying solely on raw time-series data. This demonstrates that the informational value of spectrum analysis far exceeds that of traditional signals, and FFT is the indispensable tool that “unlocks” this information.
In summary, the accuracy of FFT comes not only from its ability to convert vibrations into frequencies, but also from initiating the entire spectrum analysis process. This allows us to identify abnormal frequencies hidden in vibration noise, map them to structural components, track deterioration rates, and predict maintenance timing. What today’s manufacturing sites need is no longer just “reactive repairs” or “time-based maintenance,” but intelligent decisions that can be explained clearly, justified with data, and predicted accurately. This is the fundamental transformation brought about by the synergy of FFT and spectrum analysis.
| Comparison Item | FFT | Spectrum Analysis |
|---|---|---|
| Definition | An algorithm | An analysis technique and method |
| Function | Converts time-domain data into frequency-domain data | Interprets frequency data to identify anomalies, patterns, or trends |
| Tool Nature | Mathematical computation | Comprehensive interpretation and diagnostic process |
| Includes Interpretation | No, only produces data | Yes, e.g., interpreting frequency peaks, comparing with fault bands |
| User Knowledge Requirement | Requires basic mathematical knowledge | Requires engineering experience and mechanical background to interpret data meaning |
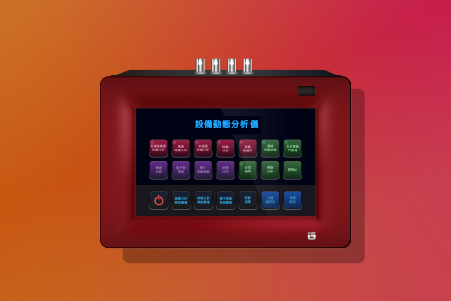
VMS-PH Dynamic Equipment Analyzer
Measure anytime, anywhere—suitable for inspections across various fields. The VMS®-PH Dynamic Equipment Analyzer is designed for high-end instruments, integrating over 20 vibration measurement functions, including spectrum analysis, time-frequency analysis, vibration transmissibility, and dynamic analysis.
Dynamic Equipment Analyzer